 Mantys Core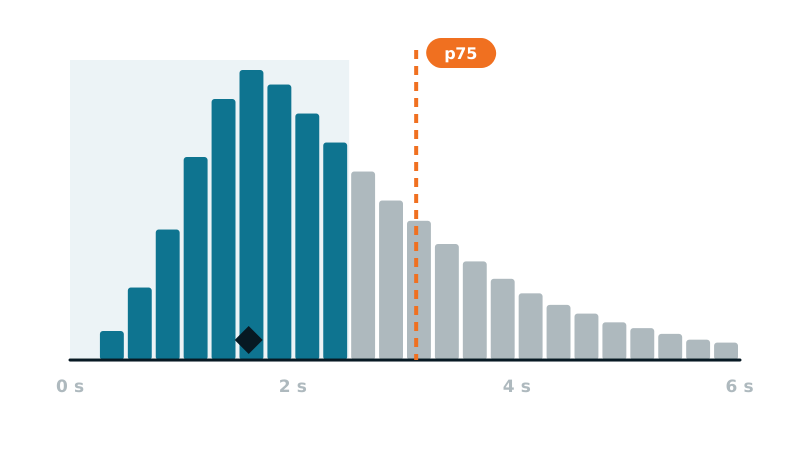
Two situations come up again and again. In the first, the PageSpeed report is green while Search Console lists hundreds of “Poor” URLs on mobile. In the second, even more common on sites whose visitors browse on good connections, PageSpeed shows an orange or red score while Search Console says every URL is “Good”. Which one is lying?
Neither. They do not measure the same thing. Once you know what each one sees, the gap between them tells you which case you are in, and what to do about it.
Two kinds of measurement
Lab data is the score and the metrics at the bottom of the report. It is one simulated visit: one emulated phone, a throttled connection, an empty cache, from a Google data center, and nobody touching the page. It is repeatable, which makes it good for debugging, and it ends when the page has loaded.
Field data is what Search Console uses, and what the top of the PageSpeed report shows under the real users section. It comes from the Chrome User Experience Report: real Chrome visitors, their devices, their networks, over a rolling 28 days. A page passes when 75% of visits are good, so the slowest quarter of your audience decides.
Case 1: green lab, poor field
Here the test is kinder than reality. Six reasons explain it:
1. INP does not exist in the lab. Interaction to Next Paint measures how fast the page reacts to clicks and taps. The lab never clicks. Worse, an optimization that postpones JavaScript until the first interaction improves the lab and can make the first real tap slower. See the JavaScript delay guide.
2. The lab stops at load, CLS does not. The field counts layout shifts during the whole visit: while scrolling, when a banner slides in, when an ad or an embed resizes. A lab CLS of zero says nothing about what happens below the fold. The usual culprits on page builders are in our CLS guide.
3. Real devices are slower. The 75th percentile of your audience may be an older phone on a weak connection, well below the lab profile. A page that barely passes in the lab fails for them.
4. Real visits miss your cache. The lab often hits a warm page cache. Real traffic includes uncached pages: first visits after a purge, logged-in customers, and URLs with tracking parameters such as utm_source, gclid or fbclid, which many caches treat as new pages. Their server response time lands in the field LCP.
5. Search Console groups URLs. The report shows groups of similar pages, and pages without enough traffic inherit the data of their group or of the whole site. The URL you test may not be the one dragging the group down.
6. The window is 28 days. A fix shipped today is fully reflected in about four weeks. Retesting the next morning in Search Console shows the old data.
Case 2: mediocre lab, green field
Here the test is harsher than reality. The mobile lab run emulates a mid-range phone with a CPU slowed down four times and a throttled mobile connection of about 1.6 Mbit/s with 150 ms of latency. That profile is deliberately pessimistic, and many real audiences are far faster than it:
- Faster networks and phones. Visitors on fiber, fast 4G or 5G, with recent phones, finish loading well before the emulated device. At the 75th percentile, they stay in the green.
- Warm visits. Returning visitors and navigation from page to page reuse cached files and open connections. The lab always starts cold, with nothing in cache.
- Scripts cost less on real hardware. A heavy script that blocks the emulated CPU for seconds takes a fraction of that on a recent phone, so the lab’s blocking time overstates what visitors feel.
Where your visitors are decides which case you are in. An audience in countries where mobile connections are slow behaves like the lab or worse: that is case 1. An audience on fast networks behaves better than the lab: that is case 2. Search Console and PageSpeed show one figure for all your visitors together; if your audience is international, the public Chrome UX Report data can be split by country.
What to do in case 2. Google’s page experience signals use the field data, so a green field is what counts. Do not break a working site to chase a lab score. Keep the lab as a diagnostic: it shows what your slowest visitors live, and it catches regressions before they reach the field. Improve what it points at, one safe change at a time, as in our method for optimizing without breaking.
Step 1: read what Search Console actually says
- Which metric: LCP, INP or CLS. The method differs completely for each.
- Which device: mobile and desktop are separate reports.
- Which group: open the issue and look at the example URLs. They almost always point to a template: product pages, articles, category pages, the home page.
Then open one example URL in PageSpeed and look at the real users section first. If it shows data for that URL, you have the page’s own field numbers; if it shows the whole origin, the page is judged with the rest of the site.
Step 2: reproduce the field problem in your browser
For INP: open DevTools, Performance panel, set CPU throttling to 4x or 6x, record, and interact the way a visitor does: open the menu, change a variant, add to cart, accept the cookie banner. Long yellow blocks after your click are the delay. Recent versions of Chrome also show live LCP, CLS and INP values in that panel.
For CLS: reload with throttling, then scroll the whole page slowly and interact. In the Rendering tab, “Layout Shift Regions” flashes each shift as it happens.
For LCP: test the template on mobile emulation, with a URL that is not cached (add a random parameter), and look at the server response time and at when the LCP element is discovered.
new PerformanceObserver(l => l.getEntries().forEach(e =>
  console.log('LCP', Math.round(e.startTime), e.element))).observe({ type: 'largest-contentful-paint', buffered: true });
new PerformanceObserver(l => l.getEntries().forEach(e => !e.hadRecentInput &&
  console.log('CLS', e.value.toFixed(3), e.sources?.map(s => s.node)))).observe({ type: 'layout-shift', buffered: true });
Step 3: never conclude from one run
The lab score moves from one run to the next, sometimes by ten points on mobile, because the page, the network and the test machine vary. To compare two versions:
- run each version several times and compare medians, not the best run;
- space the runs out, since a result requested again within a short window can be served from a cache and repeat the same number;
- compare the same URL, same device, same conditions, with and without the change.
Reliable conclusion
Field metric identified in Search Console, reproduced in the browser, fixed, confirmed on several lab runs, then validated in Search Console four weeks later.
False conclusion
One green PageSpeed run the day after the change, taken as proof that the Search Console issue is solved.
Step 4: validate and wait
Once the fix is live, click “Validate fix” on the issue in Search Console. Validation follows the 28-day window, so plan on about a month. In the meantime, the lab and your own browser measurements are what tell you the fix works.
With Mantys Core
Mantys Core does not replace field data: Search Console and the Chrome report remain the reference. It makes the lab side of the method cleaner:
A single command runs PageSpeed on the same URL without then with the optimizations, on mobile, desktop or both, so a before and after is measured in the same conditions.
Its critical CSS is captured at the same screen sizes the speed test uses, so what the test sees at load is what was optimized.
A one-request bypass shows the raw page next to the optimized one in your own browser, which is what step 2 needs.
The field tells you where it hurts. The platform helps you prove, in the lab, that the change you made is the one that helps.
In summary
- The PageSpeed score is one simulated load; Search Console is 28 days of real visits at the 75th percentile.
- Green lab and poor field: the problem is an interaction, a shift after load, a slow device, an uncached URL or another template.
- Mediocre lab and green field: your visitors are faster than the pessimistic test profile; the field is what counts.
- Start from Search Console: metric, device, group of URLs, template.
- Reproduce it in DevTools with throttling and real interactions, then compare several lab runs, never one.
- Validate the fix and give it four weeks.
Comments
Stuck on a similar problem? Describe your setup and what you see. We read every comment and answer.
No comments yet. Be the first to share your case.